Modern e-commerce operations depend heavily on data-driven decision-making. As order volumes increase and customer expectations become stricter, businesses can no longer rely on guesswork or manual tracking to manage logistics performance.
This is where logistics dashboard KPIs become essential. They provide real-time visibility into operational performance, helping businesses understand what is working, what is delayed, and where improvements are needed.
In platforms like Shopee and Lazada, where competition is intense and delivery speed directly affects seller ratings, having strong operational visibility is no longer optional. It is a core requirement for sustaining growth and efficiency.
This article explores how logistics dashboard KPIs improve visibility, strengthen decision-making, and support scalable e-commerce operations.
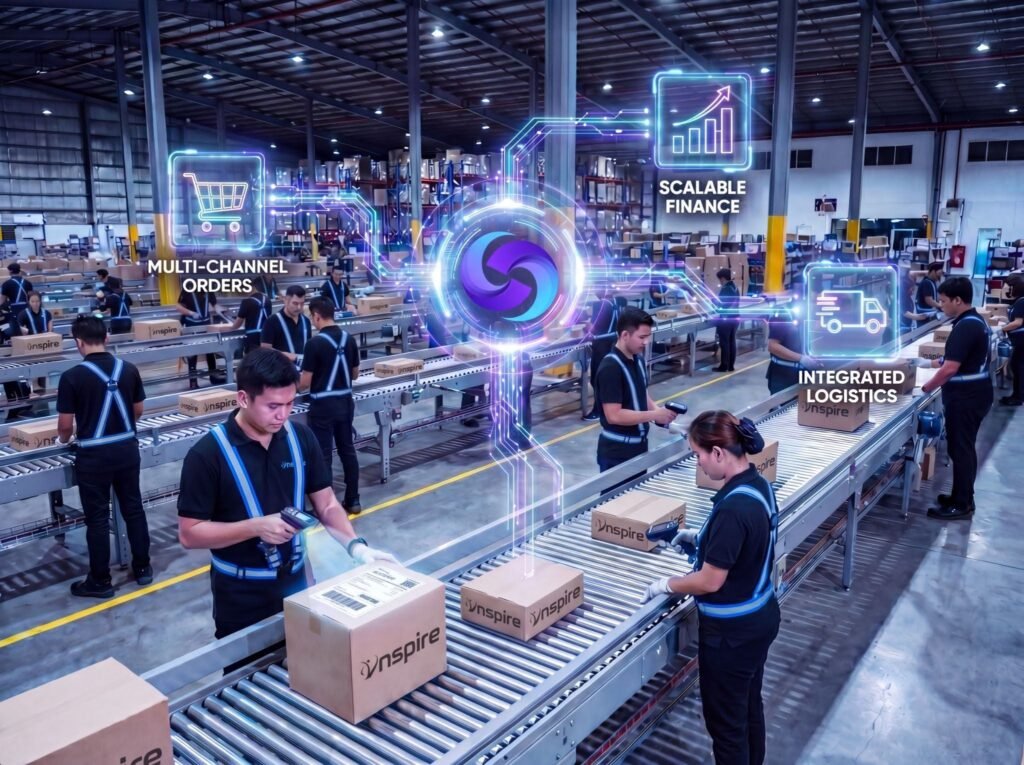
Logistics dashboard KPIs refer to key performance indicators displayed in a centralized dashboard that tracks logistics and fulfillment performance in real time.
These KPIs help businesses monitor:
Instead of manually checking multiple reports, businesses can view all critical logistics data in one place.
This allows decision-makers to react faster and make more informed operational adjustments.
Operational visibility refers to how clearly a business can see and understand its entire logistics and fulfillment process.
Without visibility, businesses face:
With proper visibility powered by dashboards, businesses can detect problems early and respond before they escalate.
For example, if shipment delays are increasing, a dashboard can immediately highlight this trend, allowing teams to adjust dispatch processes or coordinate with logistics partners.
One of the most important components of logistics dashboards is order visibility.
Order visibility ensures that every stage of an order is tracked, from confirmation to delivery. This includes:
With full visibility, businesses can provide accurate updates to customers and reduce inquiries related to order status.
This also improves customer trust, as buyers feel more confident when they can track their orders in real time.
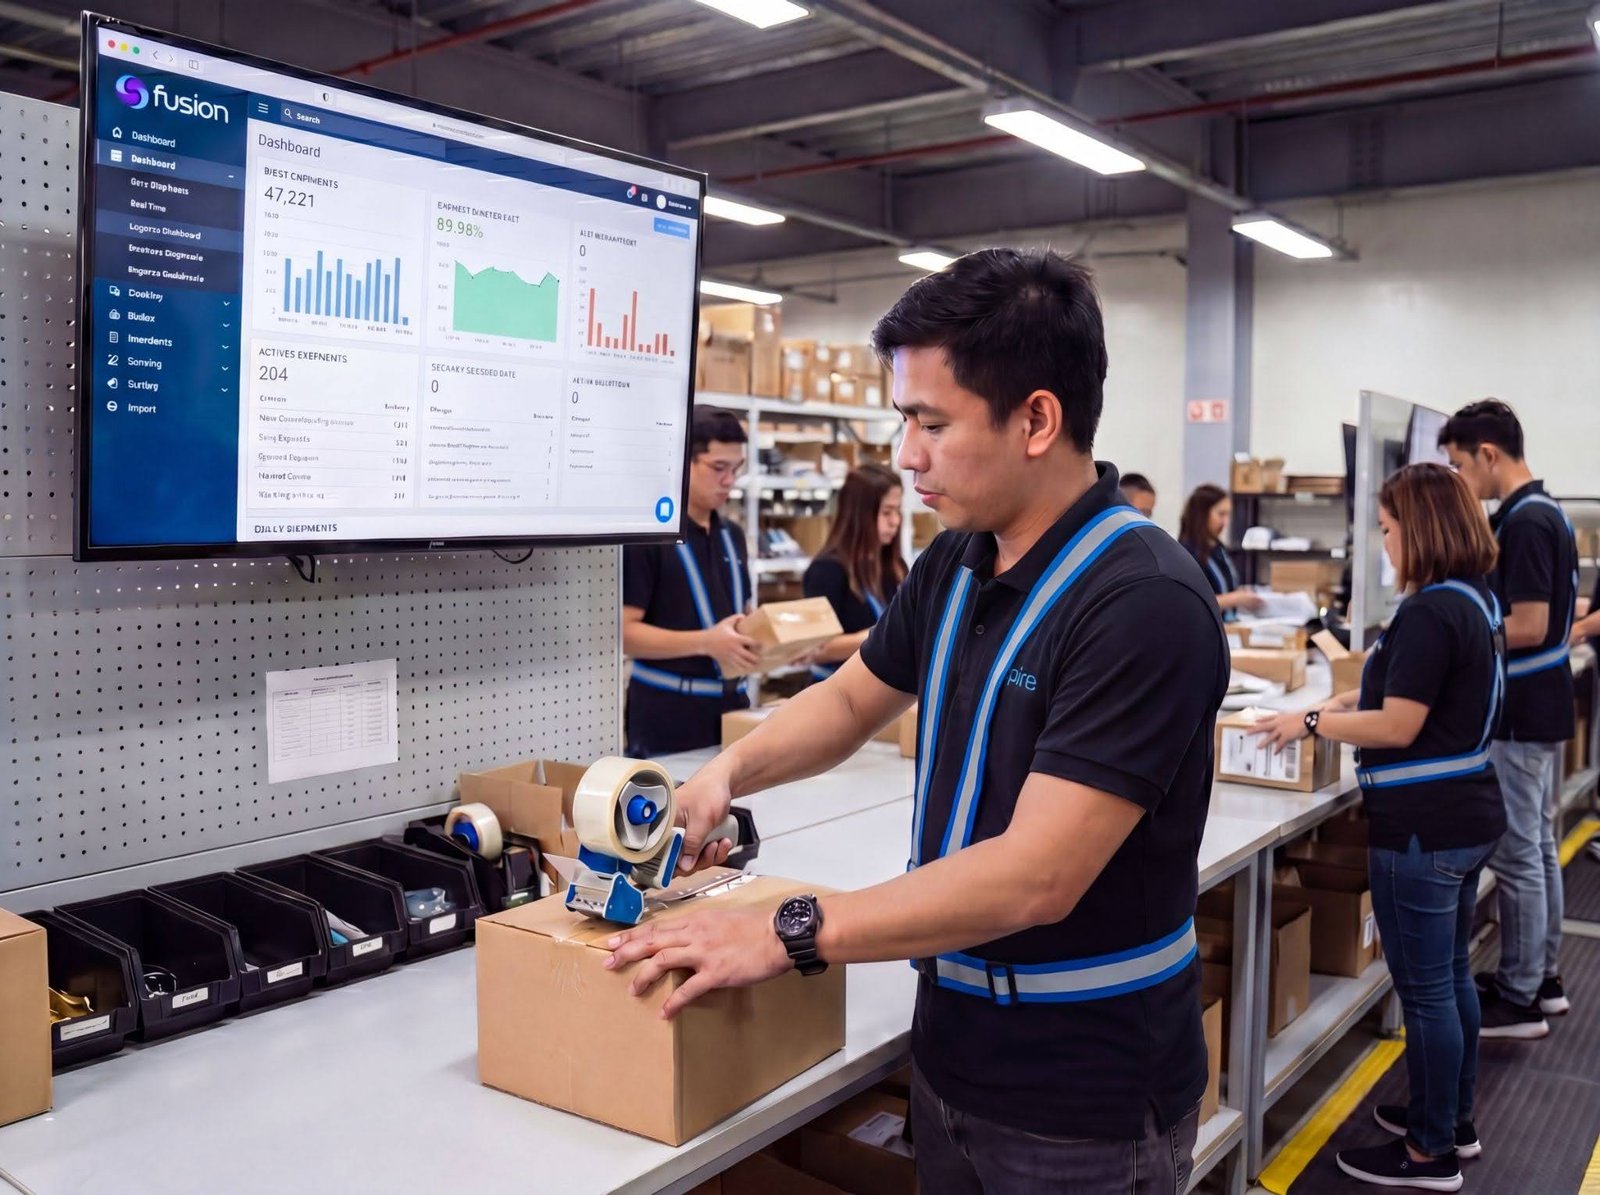
Modern logistics dashboards are closely integrated with workflow automation systems.
Instead of manually updating records, automation ensures that:
This automation reduces human error and improves operational speed.
When combined with logistics dashboard KPIs, automation creates a highly efficient system that minimizes delays and improves consistency.

In real-world operations, not all processes run smoothly. Issues such as delayed shipments, failed deliveries, or incorrect orders are common.
This is where exception handling becomes critical.
A logistics dashboard highlights exceptions such as:
By identifying these issues early, businesses can take corrective action before they affect customer experience.
For example, if a delivery fails, the system can immediately flag it for re-dispatch or customer coordination.
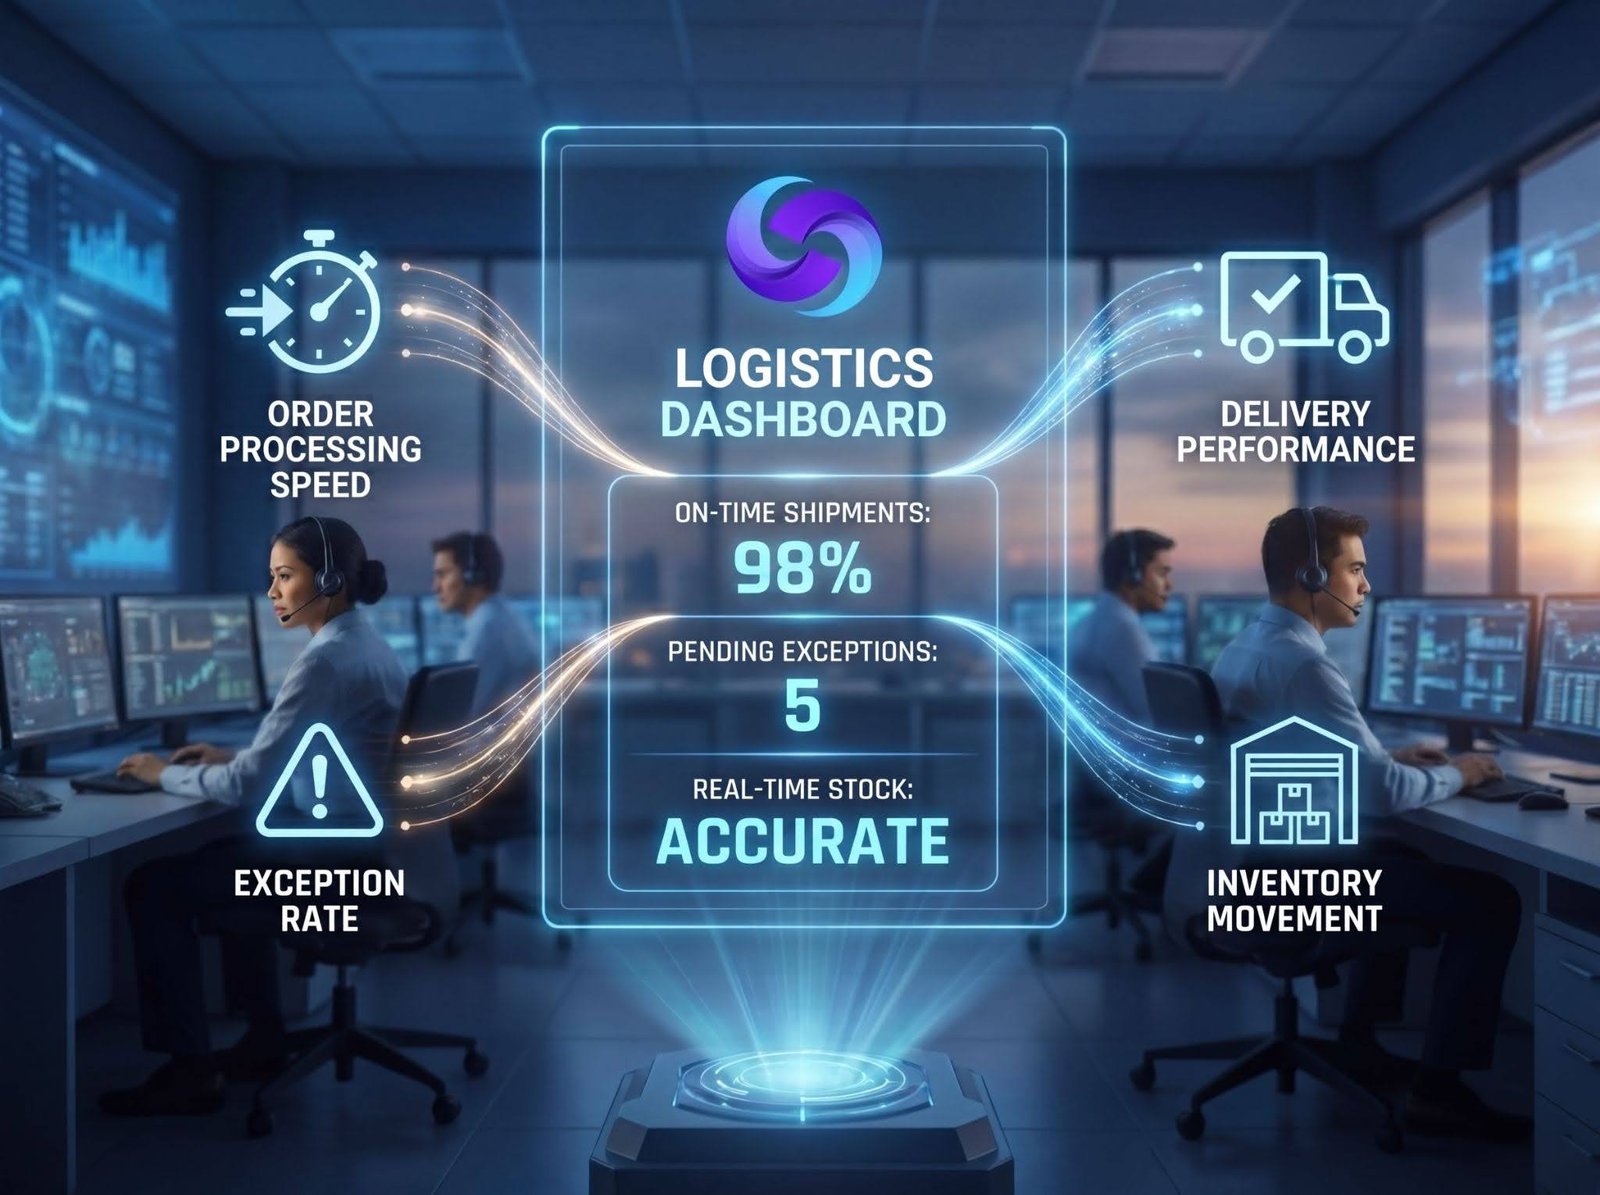
A strong logistics dashboard typically tracks several important KPIs, including:
1. Order Processing Time
Measures how quickly orders move from placement to dispatch.
2. Delivery Success Rate
Tracks how many orders are successfully delivered on the first attempt.
3. Shipment Delay Rate
Monitors delays in fulfillment and delivery timelines.
4. Inventory Accuracy
Ensures stock levels match actual warehouse inventory.
5. Exception Rate
Measures how often operational issues occur.
These KPIs provide a complete picture of logistics health and efficiency.

One of the biggest advantages of logistics dashboards is improved decision-making.
Instead of relying on outdated reports, businesses can:
For example, if dashboard data shows rising delivery delays in a specific region, businesses can adjust courier partners or improve dispatch timing.
This level of responsiveness is critical in fast-moving e-commerce environments.
Scalability depends on how well a business can handle increasing order volumes without sacrificing performance.
Logistics dashboard KPIs support scalability by:
As businesses grow, dashboards ensure that operations remain controlled and measurable.
Without this visibility, scaling often leads to chaos, inefficiency, and customer dissatisfaction.
Logistics dashboards are most effective when integrated with other systems, such as:
This integration ensures that all data flows smoothly across the entire business ecosystem.
When systems are connected, businesses gain a unified view of operations instead of fragmented reports.
Businesses that implement logistics dashboard KPIs typically experience:
In competitive markets like the Philippines, these improvements directly translate into higher seller ratings and increased sales performance.
Logistics dashboard KPIs play a critical role in improving operational visibility in modern e-commerce. They provide businesses with real-time insights into performance, enabling faster decisions and better control over logistics processes.
When combined with order visibility, workflow automation, and exception handling, logistics dashboards become powerful tools for optimizing efficiency and scalability.
In today’s fast-paced digital marketplace, businesses that rely on data-driven logistics systems will always have a competitive advantage over those that do not.
Inspire E-Commerce Solutions Inc.
Warehouse 4 & 5, C Teknik Industrial, 143 P. Gregorio Street, Valenzuela,
1442 Metro Manila
inspiresolutions.asia